
During development, debugging your application can be very useful in determining the location of defects, evaluating expressions, and understanding the overall flow of the application. Your AEM application may consist of many Models, Services, Servlets, and Schedulers you have the ability to set breakpoints in each.
Content:
- Command to start AEM in debug mode
- Start aem in debug mode using IntelliJ
- Start aem in debug mode using Eclipse
1. Command to start AEM in debug mode:
To debug your application, run the command below in your terminal to start AEM with the appropriate debug options set:
java -Xmx2048M -agentlib:jdwp=transport=dt_socket,address=8888,server=y,suspend=n -jar aem-author-p4502.jarHere In The Command:
| -Xmx2048M | 2024 is heap size |
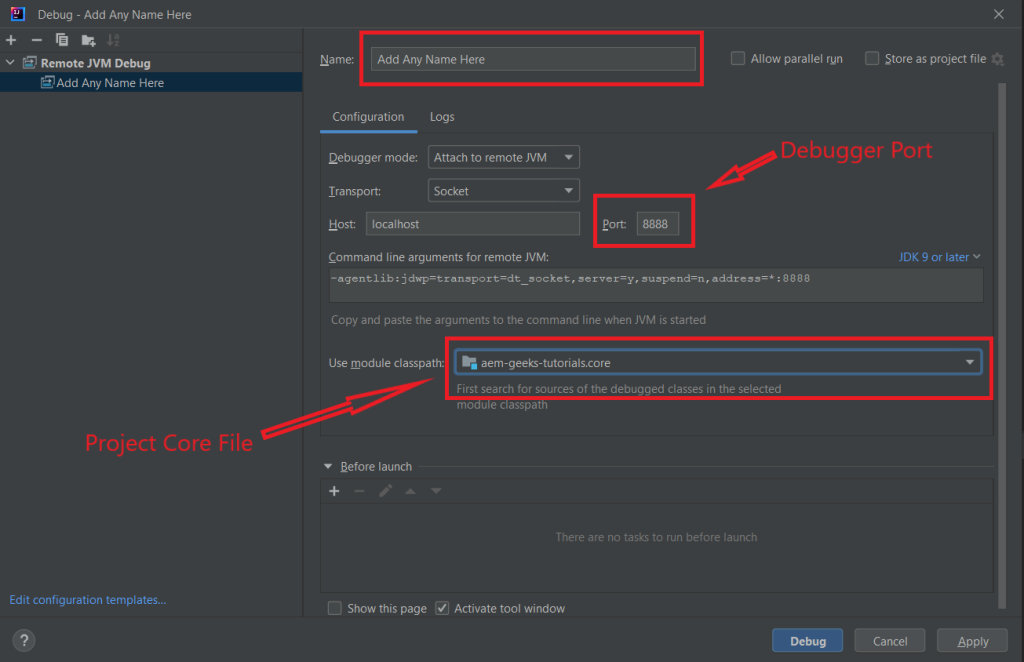
| address=8888 | 8888 is the debugger port |
| aem-author-p4502.jar | 4502 is aem author port |
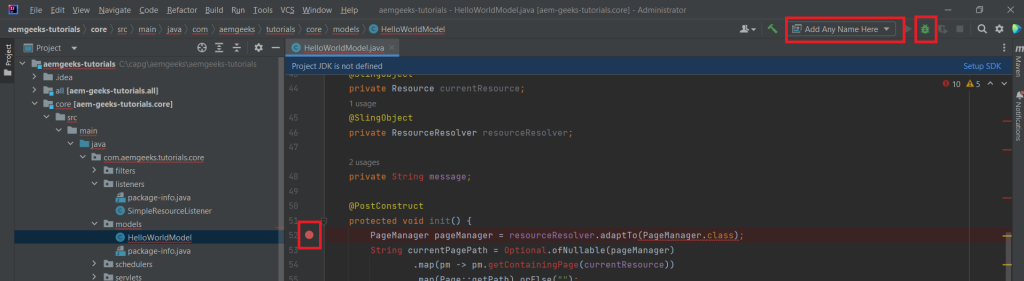
2. Start aem in debug mode using IntelliJ:
- Click the Run Tab in the IntelliJ toolbar and select “Debug”
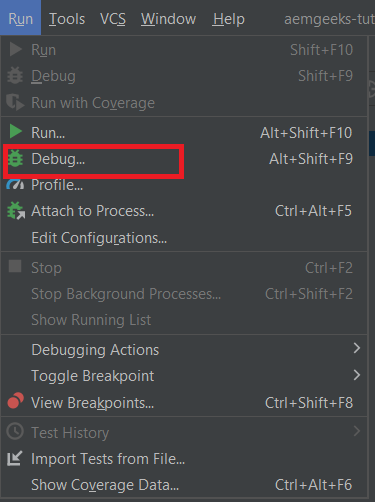
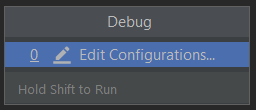
- In the Debug Options Window, select Edit Configurations.
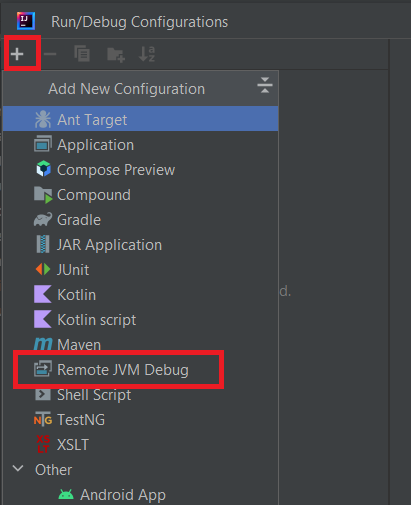
- Add a new configuration by clicking the “+” in the top left-hand corner.
- Select Remote JVM Debug
- Fill in all the details and click Apply and then Debug. A new window should open with a message saying that you are connected to the debugger.
- You don’t need to do the same every time.
Once you have done all the processes you’ll get your debugging configuration on top of the IntelliJ. To run it you can set the breakpoint and click the small debug icon ( ).
).
If you aren’t able to connect, try restarting your AEM instance. The debugger can only be connected after the AEM Instance is started by clicking The newly created debugger name.
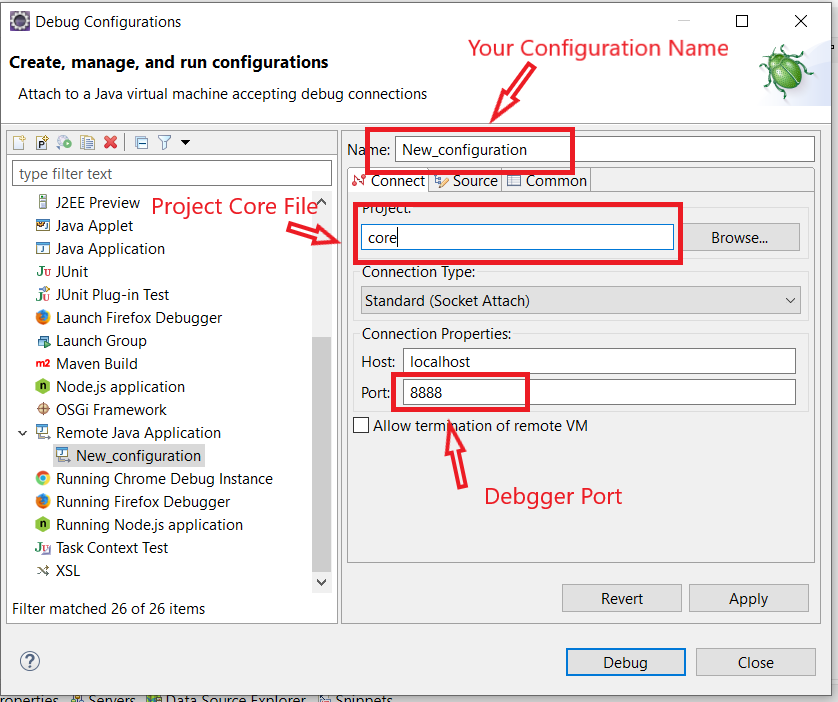
2. Start aem in debug mode using Eclipse:
- Open Eclipse then choose Run > Debug Configurations.
- Right-click ‘Remote Java Applications’ and select ‘New’.
- Select the AEM project under ‘Project’.
- Under ‘connection Properties’ enter the host. For the local dev machine, it is ‘localhost’.
- Enter the port configuration of the JVM parameter defined in step 1. In the example, we have given the port number as 8888
- Fill in all the details and click Apply and then Debug.
- Save the configuration.
- Now double-click the newly saved configuration in the Debug Configurations screen.
- Or Window > Perspective > Open Perspective > Other > Debug.
Open AEM Page containing the component which uses the java class for which the breakpoints have been added. If you’ve added breakpoints for the HelloWorldModel.java, open the page with the HelloWorld component or refresh if already opened. And that’s it, the eclipse will notify and the program will be paused at the breakpoint.
Happy Coding!
AEM Developer
Thanks for your blog, nice to read. Do not stop.